Python code to show cointegration between one financial instrument and 20 other factors
- ステータス: Closed
- 賞金: €31
- 受け取ったエントリー: 2
- 優勝者: ryosao6

コンテスト概要
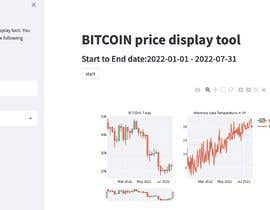
Python code to show cointegration between one financial instrument and 20 other factors.
I would like to receive code in python that plots 16 charts showing cointegration of Bitcoin with 20 different factors (listed below).
Each chart should represent a different time period:
(1) 1-minute intervals (with beginning date and end date);
(2) 5-minute intervals (with beginning date and end date);
(3) 15-minute intervals (with beginning date and end date);
(4) 30-minute intervals (with beginning date and end date);
(5) 1-hour intervals (with beginning date and end date);
(6) 2-hour intervals (with beginning date and end date);
(7) 4-hour intervals (with beginning date and end date);
(8) 1-day intervals (with beginning date and end date);
(9) 7-day intervals (with beginning date and end date);
(10) 1-month intervals (with beginning date and end date);
(11) 3-month intervals (with beginning date and end date);
(12) 6-month intervals (with beginning date and end date);
(13) 1-year intervals (with beginning date and end date);
(14) 2-year intervals (with beginning date and end date);
(15) 3-year intervals (with beginning date and end date);
(16) 5-year intervals (with beginning date and end date).
The 20 non-financial factors to be plotted for the same time periods should be:
(1) The daily high temperature in New York City on each day of each time period
(2) The phase of the moon in New York City on each day of each time period
(3) The barometric pressure in New York City at 12:45 pm on each day of each time period
(4) The price of gold for each corresponding time period
(5) The US Fed Funds rate on each day of each time period
(6) The US Unemployment rate on each day of each time period
(7) The GBP-USD foreign exchange rate for each corresponding time period
(8) The EUR-USD foreign exchange rate for each corresponding time period
(9) The USD-YEN foreign exchange rate for each corresponding time period
(10) The USD-CNY foreign exchange rate for each corresponding time period
(11) The USD-RUB foreign exchange rate for each corresponding time period
(12) The price of crude oil (CL:NMX) for each corresponding time period
(13) The CBOE VIX for each corresponding time period
(14) The number of Google searches using the word "Bitcoin" on each day of each time period
(15) The number of Google searches using the word "cryptocurrency" on each day of each time period
(16) The number of tweets containing the word 'Bitcoin' on each day of each time period
(17) The number of tweets containing the word 'cryptocurrency' on each day of each time period
(18) number of google searches with the words "hacked" and "crypto" on each day of each time period
(19) number of google searches with the word "SEC" on each day of each time period
(20) number of google searches with the word "sex" on each day of each time period
csv data files should be included, each citing the sources of the data (with links to the sources)
On each chart, the 20 factors should be plotted in order of their cointegration with BTC, highest to lowest
The winner of the competition will hopefully be awarded frequent coding jobs for our client who requested the above charts
推奨スキル
採用者フィードバック
“ashf;hsr;gisrgsigjs'dg”
![]() MIdstMedia, United Kingdom.
MIdstMedia, United Kingdom.
公開説明ボード

コンテストの開始方法
-

あなたのコンテストを投稿 速くて簡単
-

たくさんのエントリーを集めましょう 世界中から
-

ベストエントリーをアワード ファイルをダウンロード - 簡単!